
View Case Study
Help market analysts to get consumer insights easily from billions of mobile network data.
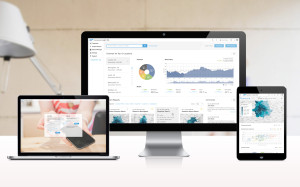
SAP Consumer Insight 365 helps enterprise professionals understand consumer preferences. Utilizing partnerships with telecommunication companies, we aggregate customer profile information and transactions of mobile calling and data. Consumers’ identities are protected because the data is anonymized. Our product gathers and aggregates 14 billion data points per day. Our challenge was to organize this data into meaningful structures and visualizations for a professional analyst. The universal challenge of taking apart massive data was finding a starting point. We had a different priority than the project owners and developers who were focused on the data itself. We asked ourselves "What questions are we trying to answer?" Using the design thinking process, we found analysts spend 50-60% of their time cleansing data to prepare for analysis, and deliver simplified visualization reports to their clients. We also discovered that analysts had diverse sets of use cases, but similar needs. Marketing analysts we talked with had different problems to solve such as looking to deliver insights or recommendations on where to open a new retail branch location, understanding the impact of an email marketing campaign, or discovering the best target audience for a product. But, the usefulness of having access to aggregated data at different snapshots in time or having the potential to find consumer patterns of geo-location and activity were common across. It is challenging to predict what data users will want to extract. Our design gives users control of creating queries from scratch with the flexibility of mixing subsets of variables from different categories of telecommunications data to discover insights in areas not on their radar. We use location and time to create order and consistency between charts on a page. The interface supports visualizations to see patterns quickly, as well as support for drill down interactions and direct manipulation.
- Why this project is worthy of a UX Award:
The product is a game-changer for the marketing industry. It enables analysts to make insights based off accurate continuous data rather than snapshots of data which they currently use. It opens the gates for those not trained in analytics, such as clients, to consume the powerful data as well. Experienced analysts may know what to look for based on experience, but we give an opportunity to all users to find patterns in data. We implemented unique features for the user to "play with data." • Charts can be merged with direct manipulation and undone with one click. • Our timeline control slider updates all charts on the page for quick and nonpermanent snapshot views. • A drill down of data can be seen by interacting with charts. There are opportunities to use our product for government purposes as well and lead to positive society impact. We have the potential to identify traffic patterns (ie. footfall, density, vehicle, mobile data usage) resulting from a new tax or policy. Leveraging this data, we could provide location-based personal assistance for first responders. With additional data we could aid in personal identity fraud protection and identification of criminal hot spots.
- Submitted By: SAP Labs LLC
See More 2014 Submissions >>