View Case Study
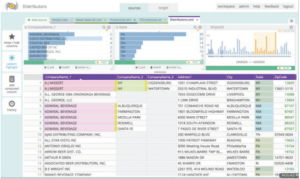
Self-service solution that cleans, combines and enriches data for analytics - no Excel or code.
Paxata’s Adaptive Data Preparation™ platform was created with the goal of empowering business analysts to prepare and enrich their own data through a visual, codeless interface. Previously, data preparation was a specialized task, requiring an organization’s IT department to sift through thousands of rows of data individually and writing schema code to parse the data, before turning it over to the business analysts. Because analysts did not have control over their own datasets, they frequently had to send it back to IT for another round of corrections until the data resembled what they needed to conduct analyses. Paxata makes all of these steps irrelevant by giving the business analyst the ability to control the entire process via an accessible UX. Specifically, Paxata’s UX is designed to function in accordance with the way that today’s business analyst is used to working. An organization’s business analysts have come to rely on being able to see their data in dashboards and other aesthetically pleasing forms, but the process required to get the data ready for those dashboards is not inherently ‘pretty.’ Exposing business analysts to the complex backend algorithms required to run Paxata would limit the platform’s usage to technical professionals. Paxata’s UX makes that process visual and guided, hiding the algorithms beneath the surface and therefore opening Data Preparation up to those without deep backgrounds in programming. Simply put: Before Paxata, Data Preparation was left to IT and data scientists. Paxata- and particularly Paxata’s UX- make it possible for the very people who analyze the data to prepare it as well.
- Why this project is worthy of a UX Award:
In the year since its official debut, the Adaptive Data Preparation Platform has already delivered proof of concept by being utilized for organizations across diverse vertical markets. At Dannon, the Platform helped business analysts discover coupon fraud and streamline the transit times of their product to a large variety of individual retailers. At Zepp, employees without any technical experience are using the interface to easily join and clean data, and have improved analytic workflows in spend analysis and strategic sourcing. All of these results are owed directly to the platform’s intuitive UX. Which allows anyone- not just data scientists- to upload data to the cloud and immediately begin preparing their data.
- Submitted By: Paxata
See More 2014 Submissions >>