View Case Study
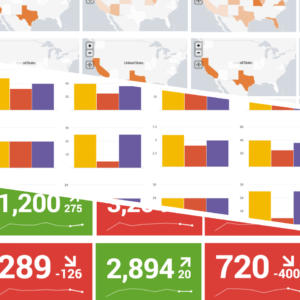
Splunk Trellis allows users to make trellis charts (aka small multiples) which just a couple clicks.
"Using a series of similar charts or graphs to conduct comparisons is a technique commonly referred to as ""trellis chart"" or ""small multiples"" (as popularized by Edward Tufte). Small multiples / trellis charts ""typically use the same scale and axes, allowing them to be easily compared. [They use] multiple views to show different partitions of a dataset"" (Wikipedia, ""Small Multiple"").
Unfortunately in modern analytics tools the actual creation of trellis charts can be difficult requiring tricky logic and additional code to be written to enable them.
Splunk Trellis allows users to take a preexisting Splunk visualization (e.g. one that shows CPU usage of many servers) and slice it on a single field, e.g., ""server."" The result in this example would be a trellis of many charts, each representing a single server's CPU usage all on the same scale and during the same time period. Traditionally this would be achieved by creation a visualization for EVERY SERVER. Not only is this a painful process, but it can also be prone to human error and maintaining dozens or hundreds of visualizations becomes very difficult. Splunk Trellis allows the visualization to be created once, and then split automatically."
- Why this project is worthy of a UX Award:
"Small multiples / trellis charts are a useful and popular way to compare a series of data. Whether you are comparing unemployment rates (http://bit.ly/2ur6NcJ) or movie trilogies (http://bit.ly/2vCG3V7) this has become an established technique for analysis.
Currently, popular tools (such as Tableau) that are great at producing charts struggle with small multiples / trellis charts. We have seen competitions that encourage users to try to build this type of visualization (https://twitter.com/VizWizBI/status/831785390965141504).
Splunk Trellis encourages designers of analytics platforms to look at ways to solve this common use case in a more simple and user friendly way."
- Submitted By: Splunk
See More 2017 Submissions >>